It's hard to stay on top of projects. Especially when team members work on different work packages that are dependent on one another. Wouldn't it be great if there was a tool that offered a transparent way to do this? There is, and it's called a Gantt chart.
In this article, we'll let you know what a Gantt chart is and how it can help you, your business, or your organization to approach processes and projects in a more structured manner.


Easily Explained Gantt Chart
A Gantt chart (or diagram) is a popular project management tool. It visualizes a project's process and tasks using horizontal bars on a timeline.
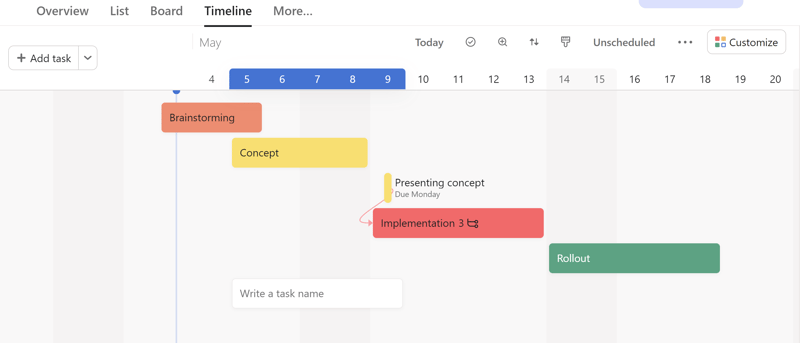
A basic Gantt chart in Asana.
A Polish engineer, Karol Adamiecki proposed a harmonogram (the first Gantt chart) in the late 19th century. Around 15 years later, an American engineer and management adviser, Henry Gantt, published his version, which now bears his name. These days, Gantt charts are one of the most well-known and commonly used project management tools.
Gantt Chart Elements
Every Gantt chart must include a few key elements to be useful to a project team. These are:
Timeline: This indicates the period of time over which individual activities as well as the project itself occur.
Tasks and activities: Every task and any subordinated assignments must be listed. These are displayed as bars along the timeline.
Milestones: These are separate from activities that require a certain amount of time. Milestones or deadlines show when a particular product or deliverable, such as a release, should become available.
Time scale: A project's leadership specifies a fixed deadline for milestones; tasks, only the other hand, need start and target dates.
Dependencies: Gantt charts must indicate dependencies between individual work packages and tasks.
Progress: A Gantt chart should clearly show where a project currently is, and if it's on schedule.
Use in Practice
Gantt charts are well-suited for a range of different projects, such as product launches, the introduction of new marketing strategies, and event planning. Whenever you need an overview that reflects any of the elements above, a Gantt chart can be a big help.
How Can I Make a Gantt Chart?
It's possible to make a Gantt chart in Microsoft Excel or with a special project management tool. Excel is a good option for the manual visualization of smaller projects and one-off cases, but it isn't ideal for regular usage and/or larger projects.
Dedicated project management software, on the other hand, offers access to all sorts of options and fields that greatly simplify the Gantt chart creation process. Team members can easily make changes or updates after you've given them editing rights.
Below, we'll show you how to quickly create a Gantt chart with project management software.
Guide: Create a Gantt Chart in 3 Steps
For our step-by-step guide, we used monday.com*. Most project management software works similarly, and you can repeat the process with the tool of your choice. Just keep in mind that some features or options might be named differently.
In our example, we planned the roll-out of a customer portal concept.
Step: Data Basis
Before you can create a clear project overview with a Gantt chart, you'll need to gather all of the necessary data. To do this, draw up a project structure plan, that fully lists all tasks, subtasks, and milestones.
Based on the tool you select, you'll also want to provide more information about responsibilities and priorities. Tasks can be arranged into sub-categories, such as the planning, execution, and implementation phases in our example below.
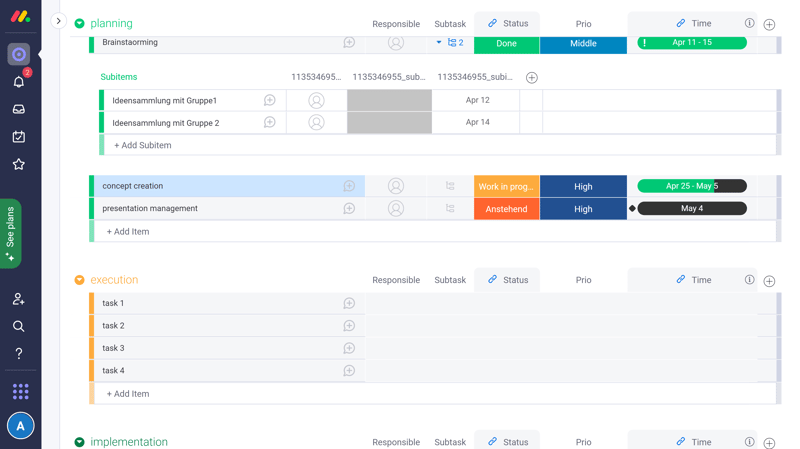
Tasks and milestones in monday.com.
Step: Time Scale
The next step firms up the time scale of your project. Ask yourself "How much time is allocated?" and "When should an assignment begin and end?". All milestones need fixed deadlines.
It's only possible to visualize your project in a Gantt chart after you've specified its time scale. After that, it will look like this:
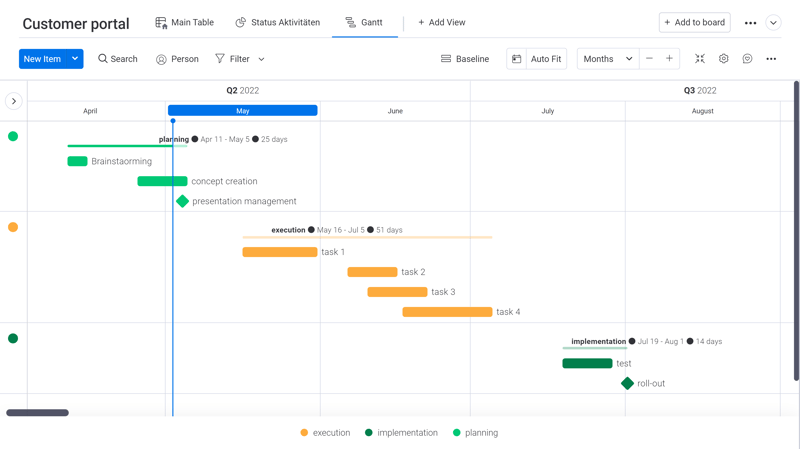
Activity and task visualization in a Gantt chart.
Activities and tasks are visualized as bars, while milestones are shown as diamonds. The blue line above the chart shows the current date and project status. In our example, we're in the Planning phase of Concept Creation.
Step: Determine Dependencies
In the third and final step, you'll need to determine dependencies between activities. Can two tasks occur at the same time, or does one need to be completed before another can begin?
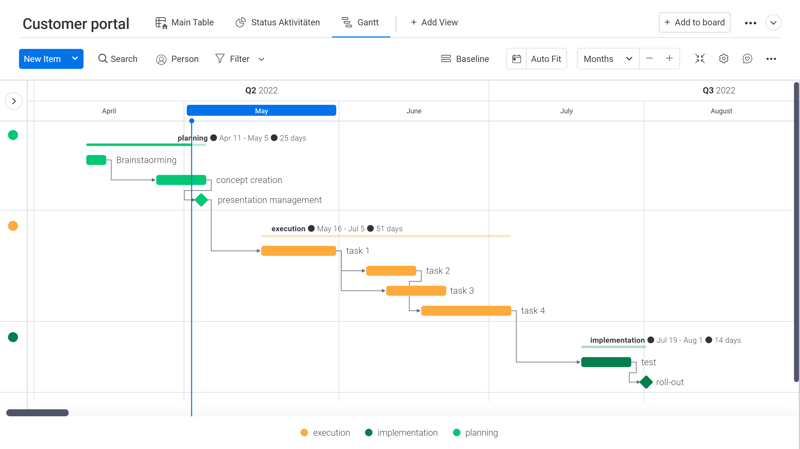
Gantt chart with dependencies.
With a tool like monday.com, it only takes three simple steps to create a Gantt chart. In case changes arise during your project, you can easily integrate them into any existing chart.
Which Projects Can Benefit From a Gantt Chart?
Gantt charts are used, first and foremost, in classic project management. Small to medium-sized projects can be easily visualized with a Gantt chart. As we mentioned above, Gantt charts are great for just about any project, however, there are certain branches where they're particularly useful.
These include production industries, where a clear visualization of production plans and machine scheduling is essential. The same goes for the construction industry since lots of organizational tasks that are often heavily dependent upon one another must be organized. The visualization provided by a Gantt chart helps to quickly show which independent tasks can happen at the same time and how best to optimize a schedule.
In short: A Gantt chart helps for any project with deadlines, detailed tasks, and dependencies.
But what about agile projects? At first glance, a linear Gantt chart seems like the polar opposite of a flexible and agile project management approach such as Scrum. However, Scrum teams can use Gantt charts. They're particularly helpful for stakeholder communication. Many systems automatically create Gantt charts for Scrum artifacts. Owing to Scrum's flexibility, elements and deadlines aren't etched in stone, and constantly change.
Advantages and Disadvantages of Gantt Charts
The visualization of a project's tasks and assignments offers a number of advantages since it makes them more tangible. However, there are several other aspects that can positively or adversely impact a project's success.
Advantages
Clear overview of all activities over a project's life
Visualization of dependencies
Better resource management
Easier to pinpoint a project's current status
Can assist in stakeholder communication
Make changes at any time
Disadvantages
Set up time increases with project size
As detail is added (such as task descriptions), clarity is lost
Charts can be very complex for larger projects
Linear project planning restricts flexibility
Gantt Chart Alternatives
There are many other charts and visualization tools apart from Gantt diagrams. Some of the most popular alternatives include:
Timeline: Add events or milestones to this without the level of detail found in a Gantt chart. This is particularly easy to do, however, it might generate more questions owing to its superficiality. Still, timelines are a great option for small or straightforward projects.
Kanban board: On this, you'll be able to monitor the progress and status of all tasks. Assignments move from left to right through "Open", "In Progress", and "Done" columns.
Network chart: Use this to quickly identify dependencies, tasks, and corresponding resources.
Checklist: This old-fashioned method is excellent for simple and small projects. Instantly see what's been completed and what still needs to be done.
Conclusion
Gantt charts offer a practical way to visualize projects and processes. Use one to easily see which assignments are up ahead, how much time they'll need, and whether they're dependent on any other activities or tasks.
Managers can apply this method to not only direct projects but also to interact more effectively with stakeholders, keeping them up-to-date about the most recent developments and progress.