Milestone Trend Analysis: Easily Explained + Free Templates


Management teams handling large projects don't have it easy: Important meetings and completed milestones pile up quickly. How could anyone keep track of all the moving pieces and ensure that it's on time and schedule?
Milestone trend analysis helps management teams to guide and plan the projects they oversee. In this article, we'll show you exactly how it works and let you know how you can perform milestone trend analysis.


Definition
Milestone trend analysis (or MTA) is a method and diagram that visualizes a project's milestones over time. Milestones can be fixed dates or events at which a specific result is awaited or a decision is met.
These diagrams also show how a milestone progresses over time and whether it's delayed or ahead of schedule.
Milestone trend analysis diagrams offer an informative tool that displays all of a project's milestones.
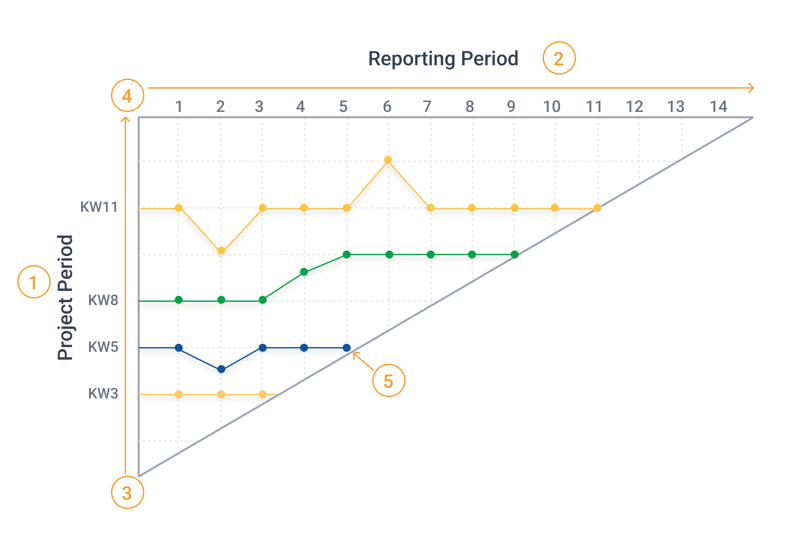
The diagram consists of a horizontal x-axis and a vertical y-axis, and provides the following information:
- 1.
Milestone dates: The y-axis displays the amount of time a project is allocated, with its meetings and milestones plotted along the way.
These can be fixed appointments, like in our example, that refer to a specific calendar week. To ensure that the MTA is as detailed as possible, we recommend specifying fixed deadlines or meeting dates.
- 2.
Reporting period: A project's management team regularly prepares reports that reflect a milestone's progress. Plotted on the x-axis, the frequency and amount of these varies and should be adapted to the project's needs.
Just like with the project's timeframe, for maximum transparency, we also recommend specifying the intervals at which reports are produced.
- 3.
Project start date: In addition to the milestone dates, the project's start date is also included on the y-axis. Typically, this is the first milestone on the diagram.
- 4.
Project end date: This is also included on the y-axis and generally is the last milestone.
- 5.
Milestone progress: Each milestone has a target date which represents when it should be delivered. As the diagram progresses, it can be seen whether this will be met ahead of schedule, on time, or behind schedule.
We'll discuss more about how to interpret this information below.
Next, we'll briefly look at how MTA diagrams are used in practice.
Milestone Trend Analysis in Practice
Project managers have a range of different tools to ensure that their project is completed successfully, one of which is MTA.
This diagram quickly shows how a particular milestone develops. Is the project on time or delayed? MTA diagrams help management not only identify potential issues but also, take steps to correct them.
Attention will be drawn to challenges and open assignments through regular reports, with any relevant questions relating to milestone planning easily addressed.
Guide: How to Create a Milestone Trend Analysis
There are plenty of tools available online that help to create an MTA. It's even possible to make an MTA diagram in Excel or use a ready-made template. Once you have a template, all you need to do is follow these three steps:
Specify the Project's Milestones
Set dates for important events and deliverable deadlines. Make sure that these are realistically spread throughout the project. To input this data into Excel, specify the milestone and its due date.
Fix the Reporting Periods
In the second step, you'll determine your reporting intervals. Whether you decide to do this on a weekly, monthly, or other basis, depends entirely on your project.
In our example, the project's management team prepared a report every calendar week.
Enter Report Results
Once milestones and deadlines have been fixed, all that's left to do is determine a particular milestone's status at the time of reporting. This shows a milestone's progress.
How to input the status? In our example, we supposed that milestone 4 would be completed in week 12. As of the time of our report in week 1, our opinion had not changed.
For that reason, the report still shows milestone 4's completion date as being week 12.
In the second report, for week 2, we learned that preparations for this milestone were well-advanced and that the milestone would likely be reached ahead of schedule.
As a result, we moved its completion date ahead to week 11.
If using Excel, such as in our example, this looked like the following:
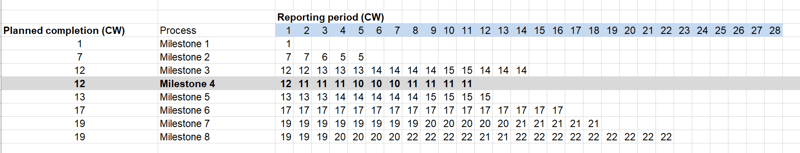
Result reporting in Excel.
Said differently, the project's management team assesses when each of the project's milestones should be completed in every report. This approach is the same for every milestone and over time might look like the following:
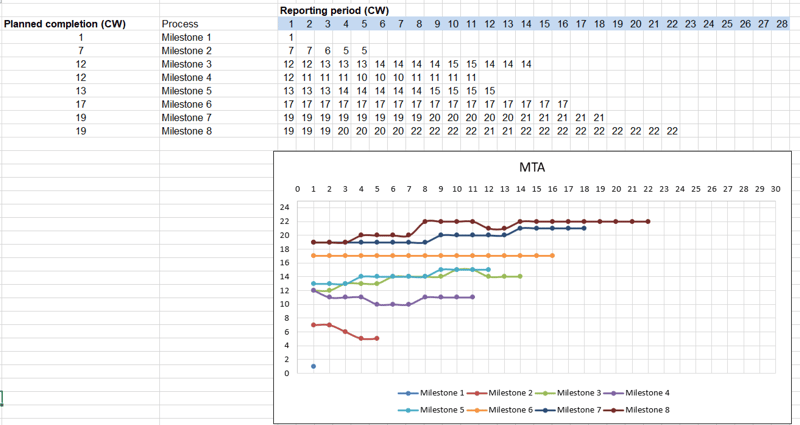
Throughout a project, an MTA diagram can end up looking like this.
Now, the management team needs to correctly read the diagram.
Accurately Read the Diagram
A project's management team can only adjust a project's course with an MTA if they're able to read and interpret what its curves mean. In general, there are three types of MTA curves:
Horizontal (straight): Milestone is proceeding according to schedule.
Upward: The original deadline will likely not be met.
Downward: Completion will likely occur ahead of schedule.
If they could choose, every project leader would select either a horizontal or downward curve for their project, however, all three come into play in practice.
Sometimes, all milestones within a project experience a change at some point in time, which impacts their curves, such as in the examples below:
A Rocky Start
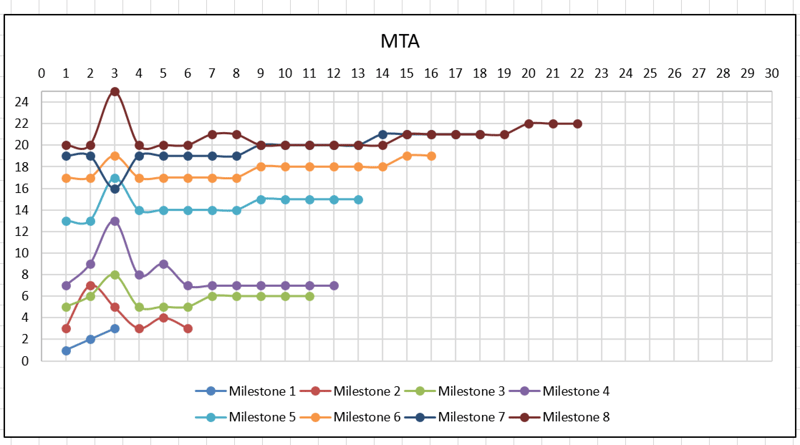
An MTA diagram might look like this if the project gets off to a rocky start.
Do many of your milestones need to be pushed back right at the beginning of your project? If so, the project has gotten off to a rocky start and your graph's curve will reflect this.
More than that though, this signals that the project wasn't as realistically evaluated as it needed to be. Alternatively, the team might not be exerting enough effort into completing the individual milestones.
As a third option, there could be misunderstandings, a lack of acceptance, or even resistance within the project's team members to the milestone they've been assigned.
Whatever the case, the management team needs to determine what the reason is and clarify the matter with the team(s) involved. After that, measures can be taken to stabilize the curve.
Climbing Line

A climbing line in an MTA diagram.
Climbing MTA lines might appear harmless, however, they can easily throw an entire project off balance. In the example above, the project should have been stopped long before the report for week 13 was plotted.
None of the milestones have been completed, and deadlines have been consistently pushed back.
What happened? Just as with the first example above, there could be several reasons for the trend in this diagram.
The project might not have received the resources it needed, or there's a lack of respect and acceptance for the project's management. Teams might not take the milestone deadlines seriously, or be overburdened and challenged.
When this kind of pattern is identified early, it can be easily fixed. However, the longer it goes unnoticed or unaddressed, the greater the likelihood that the project will go off the rails or need to be started over.
Here too, managers should analyze the reasons for the discrepancy between planning and reality.
Advantages and Disadvantages
As with every project management method, MTA diagrams have advantages and disadvantages, such as:
Advantages
Provides early warning about delays or disruptions
Allows for predictions to be made about project progress
Straightforward model with clear data
Well-suited for stakeholder communication
Can be used in both smaller and larger projects
Disadvantages
Does not account for milestone dependency
No partial results, only deadlines and target dates
Relies on subjective estimates
Changes in milestones need to be interpreted and properly understood
Free MTA Templates
Are you ready to conduct your first milestone trend analysis? If so, you can download our free MTA Excel template and add your content to it.
Alternatives
Milestone trend analysis can be used by a variety of different projects. However, depending on which information the project management team needs to direct its course, there are other methods.
One of these is a Gantt chart, which also takes the dependency of tasks upon one another into account. You can read more about Gantt charts in our EXPERTE.com guide.
Conclusion
Milestone trend analysis offers an easy way to direct a project. Users can keep track of a project's milestones as well as their estimated completion dates. Creating an MTA diagram is easy, with plenty of different templates available.
Both small and large projects can benefit from the advantages an MTA diagram offers. They warn about potential difficulties, but only if the management team accurately uses them and properly interprets their curves.
Even then, management still has to be willing to correct milestones that are not proceeding according to schedule.