Create a PERT Chart: Your Next Strategic Project Planning Tool

Efficient planning and control are key to dynamic project management. Thankfully, there's a huge assortment of tools and methods to monitor and coordinate tasks, resources, and their dependencies. One of the most popular of these is a PERT chart.
So, what does this acronym stand for? What advantages and disadvantages does this method have? And, most importantly, how can you make a PERT chart for your team, project, or organization?
We'll answer all of these questions and more below, as well as provide you with some useful tips for how to harness the power of a PERT chart.


Fundamentals of a PERT Chart
PERT stands for "Program Evaluation and Review Technique", and is a kind of project management method that's used to visualize and coordinate tasks within a project.
The method's roots can be traced to the late 1950s: At that time, the US Navy was working on the Polaris submarine, and wanted to better control and coordinate complex military projects. These days, PERT can be found practically everywhere, from IT to construction.
Definition: What Is a PERT Chart?
A PERT chart is a project management tool that helps the project director to plan, organize, and coordinate a project's tasks and assignments.
All of the tasks that are to be completed for the project to be considered successfully concluded are visualized. Beyond that, relationships and dependencies between the tasks are indicated.
This allows project managers to easily identify which tasks can be worked on simultaneously and which can start only after others finish. At the same time, the chart helps to find and manage potential risks and head off delays.
There are two kinds of PERT charts: Traditional and enhanced.
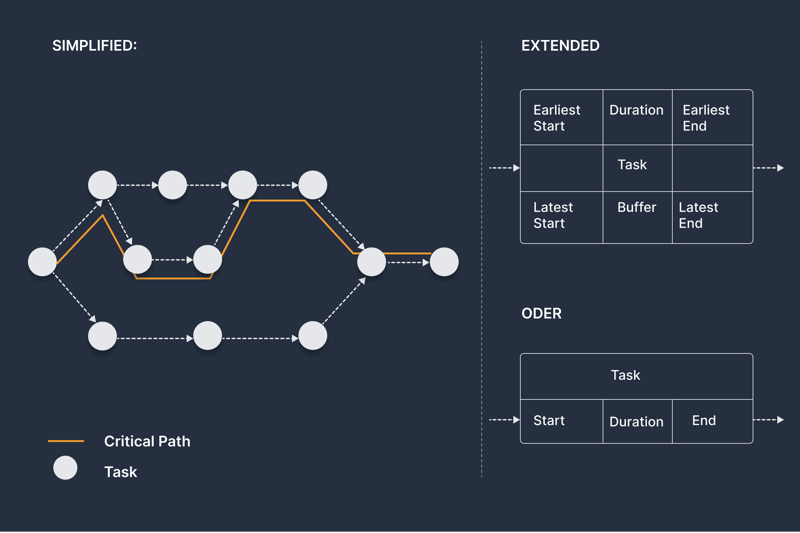
A PERT chart helps to clearly visualize a variety of information.
Based on what you want to visualize, the following can be read from a PERT chart:
Tasks: Every node (circle or rectangle) represents an activity, a task, or a milestone. Sometimes, a task is visualized in a table with different fields and further information such as its slack, as well as start and end dates.
Sequence: Arrows indicate in which order tasks are to be completed. This reveals which tasks can only start after their predecessor has been completed, as well as which can be worked on in parallel.
Dependencies: Dependencies can also be easily identified through arrows.
Duration: The information tables for tasks often include details about their start and end dates.
Critical path: The critical path is visible in both traditional and enhanced PERT charts. It shows the sequence of activities from a project's beginning to its end and is essential for project management. Delays have a significant impact on this path since they affect the entire project.
Differentiation
PERT charts look very similar to flow charts that visualize a project's process and progress. At the same time though, they're also network diagrams, which clearly establish and display dependencies between individual steps or actions.
However, even though a PERT chart is a type of network plan, the two terms aren't interchangeable. This is because a PERT chart uses the activity-on-node (AON) method, which makes it a special kind of network diagram. In this, tasks and milestones form the "activity nodes".
It's also important to keep in mind that while a PERT chart uses the AON method, not every AON diagram is a PERT chart. Despite this, the two terms are often (incorrectly) used in practice as synonyms.
PERT Chart Advantages and Disadvantages
The advantages a PERT chart offers are enough to convince many project managers that they should use it. But what disadvantages does it have? Below, we'll take a look at both.
Advantages
Managers gain a comprehensive visualization of remaining work and tasks.
Dependencies and relationships between assignments are highlighted.
The critical path helps to identify potential challenges and prioritize tasks so that the project can be completed on schedule.
With additional information, such as resources, can make planning more efficient.
Helps manage risk.
Makes it easy to monitor a project's progress.
Simple chart that be used to communicate results.
Disadvantages
For large projects, the chart becomes more complex, which makes effective management harder.
Length estimates can be inaccurate, which reduces the chart's meaningfulness.
Not particularly flexible or adaptable.
Focus is on scheduling, other aspects tend to be secondary.
Requires specific know-how and/or good tools to make.
Create a PERT Chart: Follow These 5 Steps
Would you like to use a PERT chart for your project? It's actually easier than you might think. Below, we've prepared a step-by-step guide and some tips.
Step | Description |
|---|---|
Step 1: Define tasks | Notate all tasks and activities that must be completed to reach the project's goal. |
Step 2: Organize tasks | Arrange the tasks and activities with attention paid to their dependencies and chronological order. Which can be done at the same time, and which needs to be completed before others can start? |
Step 3: Create a chart | Now you'll make the actual chart. Every task is visualized with a node, and arrows between nodes signal a relationship or dependency of one factor to another. It's best to use special software for this since it greatly simplifies both creation and management. |
Step 4: | Estimate how long a particular task will take and note it in the node. Based on which type of visualization you use, you can also specify the start or end date, or slack. |
Step 5: Identify the critical path | Finally, you'll need to identify the critical path, since this is of particular importance to the project's success. It will also help you direct the project and prioritize its tasks. |
Usage Tips
Would you like to get the most out of your PERT chart and keep potential disadvantages to a minimum? We've included a few usage tips that you can go through, like a checklist, to maximize your PERT chart's benefits:
Maintain an overview: Try to keep an overview of all tasks. Don't get lost in details, and focus instead on the critical path, since this can be the difference between a successful and an unsuccessful project.
Make realistic estimates: Be as realistic as possible when you estimate how much time is needed to complete a particular task. Overestimates can generate slack, which unnecessarily consumes resources. By the same token, if you underestimate the amount of time needed, the entire project can be doomed before it even gets started.
Work as a team: Involve team members in the process so that you can utilize their expert knowledge and introduce a solid plan.
Use tools and aids: There are plenty of tools and software that help create and manage a PERT chart. They simplify your work and save valuable time.
Stay flexible: Even though a PERT chart is relatively static, try to remain as flexible as possible.
PERT Chart Tools
There are a number of tools that can help to create and manage a PERT chart. All of them are more flexible and versatile than self-created Excel or PowerPoint templates and will allow you to quickly communicate important information.
Below, we've briefly summarized a few tools that you can use to create PERT charts and other diagrams:
Microsoft Visio
Microsoft Visio is a powerful tool with plenty of features that you can use to make complex network diagrams. Since the program has a slight learning curve, it's better for pros who create charts on a regular basis.
Microsoft Visio is a premium tool, but can prove a good investment for your organization or business.
Lucidchart
Lucidchart is a user-friendly, web-based graphics tool. Thanks to its integrated collaboration features, multiple users can work on a diagram or chart at the same time, which makes the solution a great option for teams.

Try out the free version of Lucidchart.
Miro
Are you part of a team that works digitally? If so, Miro is worth a look: The graphics tool, which was made to support Agile teamwork, offers a huge selection of templates and can be used to create PERT charts.
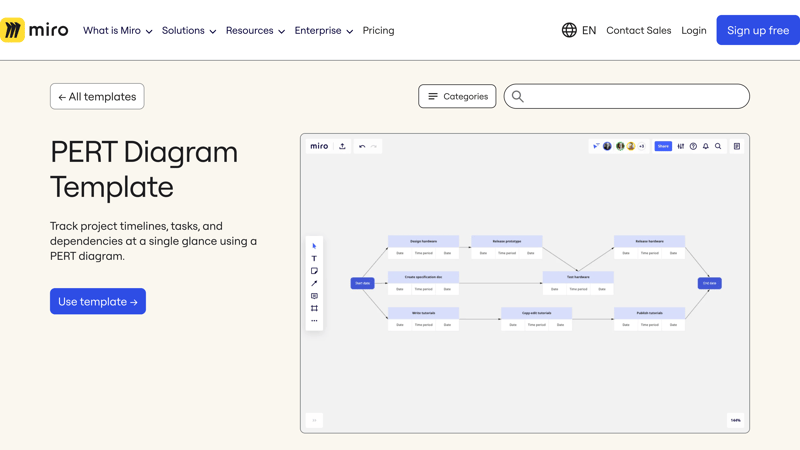
Miro is excellent for digital collaboration and offers a nice selection of useful templates.
SmartDraw
If you frequently need to create different types of charts and diagrams, SmartDraw could be a good option. It's widely known as an all-in-one diagram tool.
SmartDraw a comprehensive chart-making tool.
Creately
Creately is another web-based platform for charts and diagrams with which you can quickly and efficiently achieve solid results. What makes the tool special? Its collaborative environment includes integrated video conferencing.
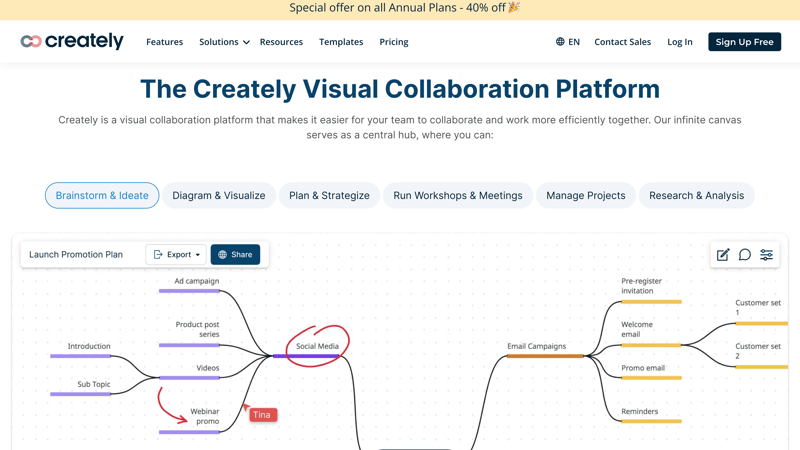
Creately serves up more than 1,000 different templates, among which are a number for PERT charts.
Which tool is the right option for you and your organization? To answer this question, you'll need to decide which factors are the most important for you. Would you like a free solution that you'll only use occasionally? Or perhaps you want a comprehensive package for different diagrams? Maybe you'd like a platform that's optimized for remote teams?
If the tool will be used by multiple people, it's a good idea to decide as a team.
Conclusion
Project managers know how hard it is in practice to direct small and large projects. PERT charts can demystify complex contingencies and visually reveal how tasks and assignments should optimally flow, to help better plan and coordinate them.
However, there are a few things to keep in mind if you intend to use a PERT chart. The keys to success are realistic planning and estimation of the amount of time needed to complete a given task, along with active team involvement in the entire process. So long as follow these guidelines, a PERT chart will enrich your project.
FAQs
A project evaluation and review technique (PERT) chart is a visual aid used to show a project's tasks and dependencies. It serves as both a flowchart and an activity-on-node (AON) network diagram.
A PERT chart is particularly useful when you need to manage a large number of interrelated tasks and dependencies within a project and want an overview of the best way to approach and complete them.
You'll need to identify and arrange a project's tasks, estimate their duration, and determine what the critical path is. The critical path is the sequence of activities within a project from its beginning to its end. Use tools like Lucidchart, Creately, or Miro for this.